Ah, here we go again! For every design leader, there’s always a moment where they need to sit down to formalize the organization’s design process and create a guide for how to systematically tackle user experience problems.
The internet is full of articles on the design process that are half: philosophical treatise and half: diagrams with more diamonds than a Jay-Z concert. Here, I’ll take a more practical approach and just present the main stages of any major product design project, listing out the tools and frameworks that you can use at every step.
Internally, I dubbed this process D3: Discover, Design, Deliver
Discover
This is my favourite! Here we toss away our assumptions and just listen and observe. And then getting our team together to come up with as many wild and elegant ideas as possible. And then, ruthlessly prioritize!

Step 1: Set goals and map out opportunities
Arrive at a list of problems and convert them into goals. At the end of this step you should have a pretty clear idea of the problem space that you are operating in.
There are two main tools to help you get started:
Business outcome mapping
Start with the business metrics the company wants to improve (e.g. increase margins, decrease churn…), and identify which leading/lagging indicators the product team can affect.
Opportunity solution tree
Visualize and chart the best path to your desired goals. Identify opportunities to improve the user-experience of your product.
Step 2: Ideate
Here’s where the whole team gets to have fun. Pick a few opportunities that look promising, and do a dive deep. Talking with users and your business partners, try to extract the tribal knowledge and analyze reports from your data team.
Just get to know everything about how things are. And then imagine how things could be!
There’s a lot of frameworks and aids to help you organize this creative process:
UX research
Gather what we know in one place. These insights can come from competitive research, user interviews, diary studies, data team, etc..
How might we (HMW) jam
Reframe the challenges we identified in our research as a hypothetical question. (e.g. “Residents often miss the rent deadline” becomes : “How might we help our residents pay their rent on time?”)
Hypothesis generation jam
Meet with all the relevant stake holders and generate as many hypothesis as possible in the format of: ”If action then effect, because reason”
Do a jam to vote on the most likely hypothesis.
Problem-solving jam
What can we design or build to test whether a particular hypothesis is true or false?
Do a jam with business & engineering partners to come up with ideas and vote on the most impactful and viable solutions.
Step 3: Prioritize
This step is decidedly less fun. Over the course of ideation, people tend to fall in love with their ideas. Yet, here is where we ruthlessly prioritize, and cut (or, more gently, push them into a mythical ‘Phase 2’) any ideas that don’t directly address business goals or which prove too complex to implement.
There are many prioritization models, so take your pick! Here are just a few that we found useful:
Kano model
Map any potential new feature along the Satisfaction and Functionality axis to determine its impact on customer satisfaction.
Impact vs Effort mapping
Get engineering and business stakeholders more involved. Have product and business folks vote on potential impact of each solution and engineers & operations to vote on the effort it might take to implement it. Matrix the results!
RICE
In cases where we have more data, we can calculate a RICE score by estimating reach, impact, confidence, and effort required to implement a feature.
Design
This is where our profession gets to shine! Once we know what we want to build and the requirements are locked down, it’s time to design.
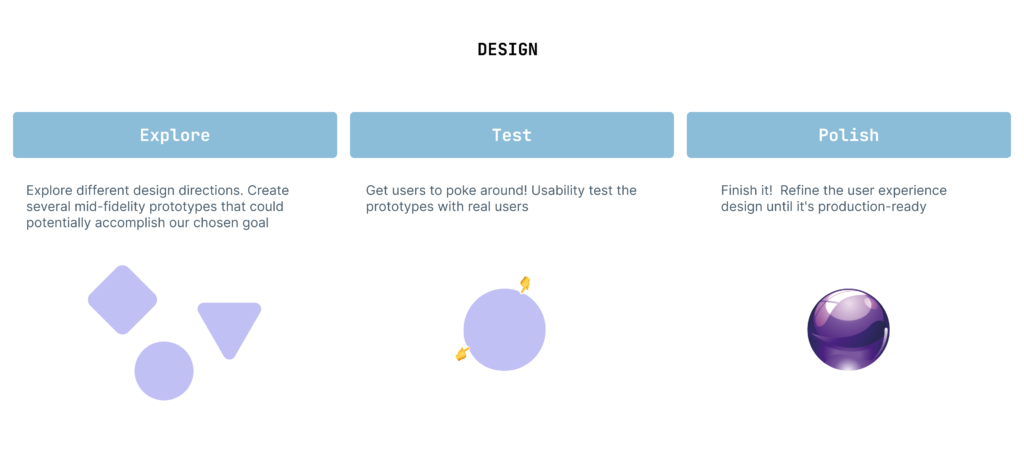
Step 4: Explore
Open your notebook or Figma or your favourite iPad sketching app and start coming up with as many design directions as you can.
Most of our Figma files have the following two pages to help with the early exploration process:
Playground
In the design tool of your choice, try to come up with at least 3-4 different design directions to accomplish the desired user experience. Try making them as different from each other as possible. At this point, it’s best to keep things lo-fi, and get buy-in for the most promising direction, before spending a lot of time making a prototype.
Bench
Research other web or mobile apps that are solving for a similar problem. Screenshot or screen record the experiences that others already came up with. Get the whole Design and Product team involved and collect all this competitive research in one place.
Step 5: Test
Time to see if your ideas work. Create interactive prototypes for a few of your most promising design directions and see how the users react.
Interactive prototypes
Create one or two mid-fidelity, interactive prototypes that allow potential users to go through the entirety of the desired user flows.
Usability tests
Connect with UX Research (or just do it yourself!) to recruit a panel of stakeholders and organize moderated (or unmoderated) usability tests. Discover how successfully users can complete desired tasks using your prototypes.
Continued iteration
Analyze the data from the usability tests, gather insights and use them to make improvements to your prototype. Repeat tests with a new group if necessary.
Step 6: Polish
Take all that you learned and iterate on the most promising design, until it’s ready to be shipped.
Design critique
Before asking for approval from the product manager, run a design critique with a group of designers to discuss the finer pros and cons of the design. This stage can also happen earlier, if there is a lot of uncertainty.
High-fidelity prototypes
Use all your learnings to create a full prototype to hand off for implementation. Make sure this prototype accounts for error states, edge cases and empty states. These should contain everything the engineers require to develop the product or feature without asking a million followup questions.
UX copywriting jam
Identify all the labels and text used in your design and jam together with your stakeholders (especially marketing!) to make sure that our writing is clear and on brand.
Deliver
The most utilitarian stage of the design process. It’s decidedly less fun, and I didn’t even manage to come up with any fun illustrations for the steps below. On the other hand, you do get to work closely with your engineering colleagues — which can be it’s own source of entertainment — and wait with bated breath as the first users get their hands on your baby.
Step 7: Hand-off
Document all the interactions, error states, edge cases and get approval on UX copy. Hand the whole package to your engineers and they will start slicing it up into tickets. Helps if you have a unified Design System!
Designer-engineer sync
When the prototype is ready and approved by product manager, meet with all engineers to walk through the whole experience, answering any questions they might have.
Design system sync
If any part of the prototype requires updates to our existing components (or creation of new ones) meet with the Design System team to make sure the enhancements are added to their backlog.
Step 8: Quality assurance
Confirm that implementation matches the designed user experience. Hopefully before it’s already shipping.
Design QA
For smaller features and enhancement, an engineer can walk the designer through the implementation on staging and together you can note any discrepancies from the approved design.
Bug bash
Once the implementation of the feature is ready for testing, get developers, product managers, designers, and end users together to “bash it out”—that is, each person would attempt to break it by hardcore testing it on staging! Create a list of bugs and enhancements to be prioritized by the product manager.
Step 9: Measure
This is at once the most important (to the business) and the most vague step in this list. In the corporate org, your worth as a designer will be measured by how well your designs improve the underlying metrics that you were targeting. At the same time, features are rarely launched in isolation and it will be hard to separate Product’s contribution to the bottom line from those made by operations, product marketing and sales.
Basic product metrics
A month or two after launch, take a stock of the most easily measurable product metrics, such as: Feature adoption & engagement rates, Funnel conversion rates, Customer satisfaction, Retention & churn rates, Error & failure rates, etc…
MBRs & QBRs
These are cross-functional strategy meetings to assess progress towards monthly, quarterly and annual goals, evaluate strategy execution, and make necessary strategic adjustments. This is Design team’s chance to have exposure to strategy and executive teams… take it!
Use this opportunity to further analyze the impact that design changes had on high-level company goals, and present it to the big wigs.